Industry Report
2023 IAA Industry Report
Despite Inflationary Pressures, the U.S. Economy Remained Resilient for the Year
Published April 30, 2024 - Written by IAA, Inc.
Summary
The 2023 IAA Industry Report is filled with data and insights on the U.S. economy, the automotive and salvage industries, metals, used-car prices, the EV market, the Canadian and United Kingdom markets, and more. Despite higher interest rates, inflation, and geopolitical uncertainty, the U.S. economy remained resilient in 2023.
Inside This Report
Section One: U.S. Economy
Section Two: Automotive Industry
Section Three: Economic Indicators of Automotive Salvage
Section Four: Electric Vehicles
Section Five: Looking Forward
Section Six: Canadian Commentary
Section Seven: United Kingdom Commentary
References
Economic Summary
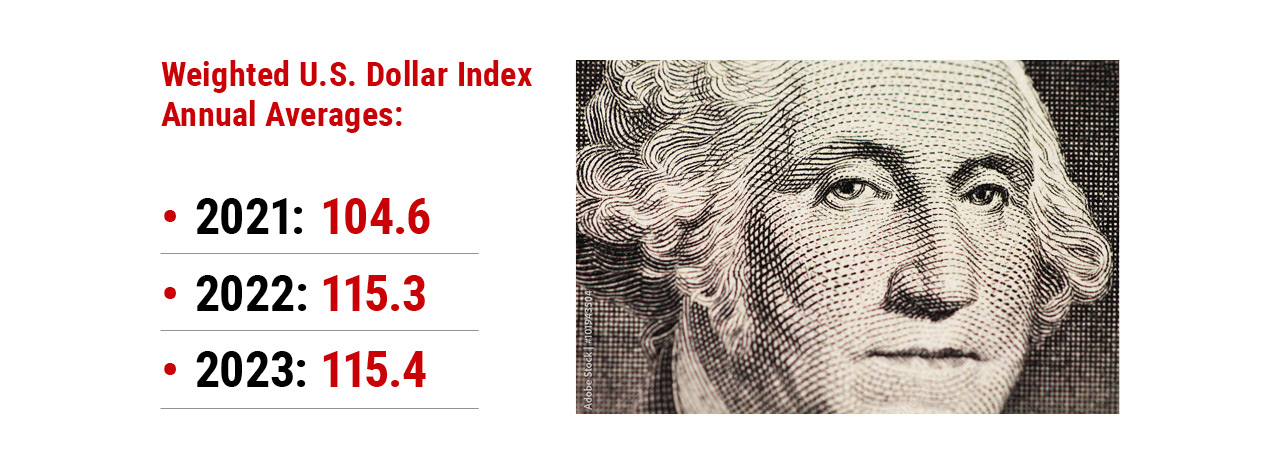
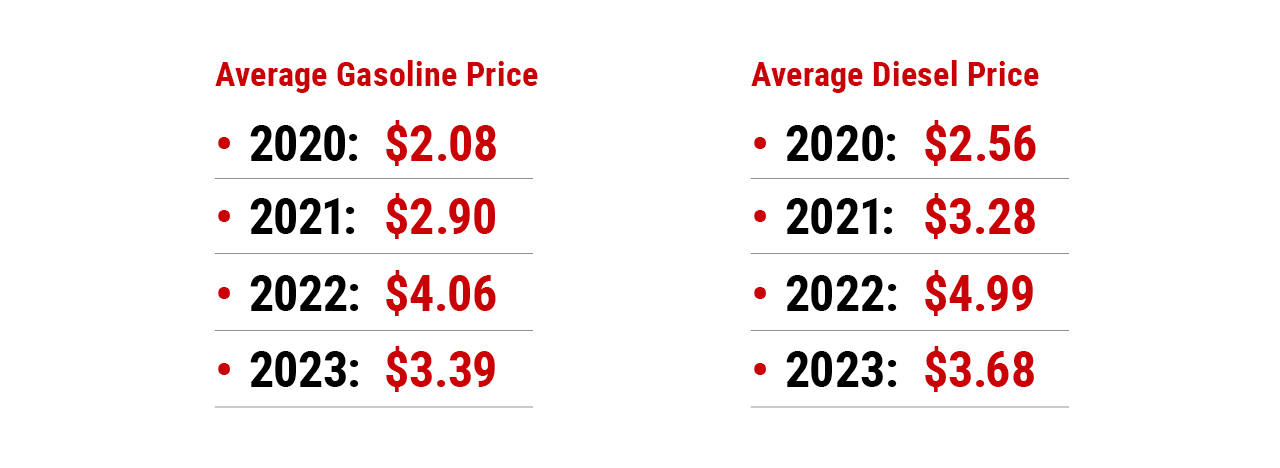
Despite concerns about the economic outlook, 2023 showed continued signs of a resilient economy. Real Gross Domestic Product (GDP) rose by 2.5%, while inflation still sits slightly above Federal Reserve targets where CPI (Consumer Price Index) only increased by 3.4% year-over-year from 2022.1 As the Fed continues to assist in lowering inflation from the all-time high during the pandemic, this downward trend should continue going into 2024.2 Additionally, the labor market remains quite resilient, as unemployment averaged 3.6% for the second year in a row and the workforce experienced an average wage growth of 5.2% year-over-year in 2023.3 As the rest of the U.S. economy continues to recover, so does the U.S. dollar. In 2023, the USDX increased by .1 (0.1% increase) from 2022, maintaining its strength in this high interest-rate environment.4 And finally, while 2022 saw record-high prices for gas and diesel, 2023 experienced a substantial decrease, going from $4.06 to $3.39 for gas and from $4.99 to $3.68 for diesel.5 While economic uncertainty is always on the horizon, these trends will be important to watch in 2024.

Automotive Summary
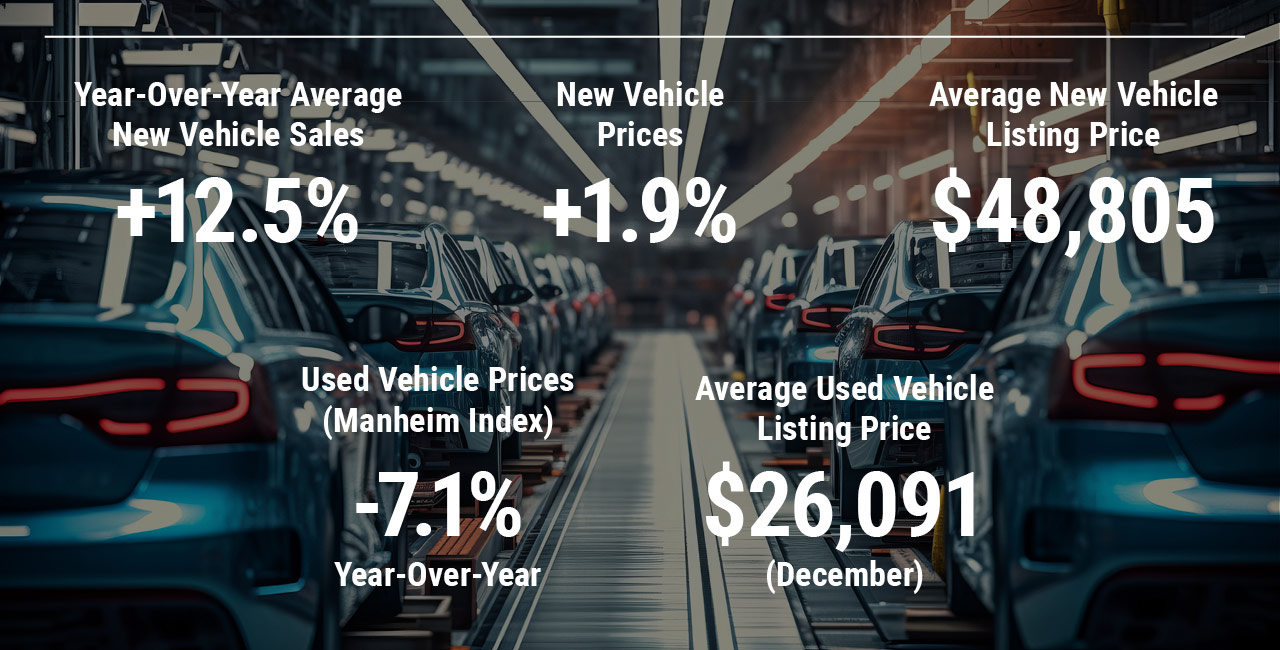
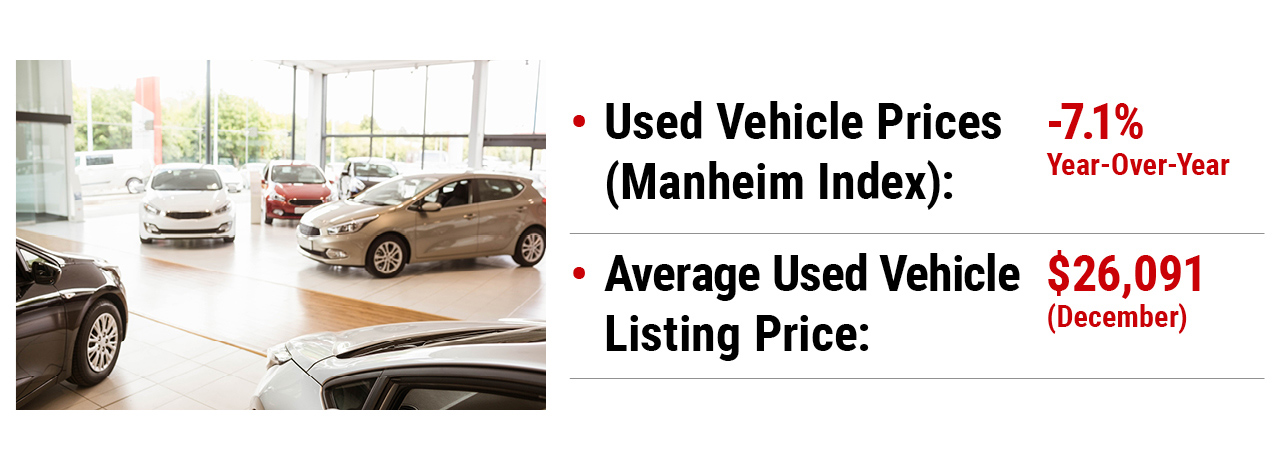
In 2023, the automotive industry saw a significant surplus in new vehicle supply, resulting in a 50% increase of inventory over the previous year, reaching 2.66 million vehicles.6 This surge in supply coincided with a 12.5% year-over-year rise in average new vehicle sales, attributed partially to the resolution of supply chain shortages, particularly the semiconductor microchip shortage that plagued the industry from 2020 to 2022.7 Despite reaching a two-year high average listing price of $48,805 for new vehicles in December 2023, actual transaction prices decreased 2.4% due to various incentives.8 On the other hand, the used vehicle market experienced a decline in prices, with wholesale prices dropping 7.1%, according to the Manheim Used Vehicle Value index, and the average listing price for used vehicles decreasing to $26,091, marking a 3.9% decrease year-over-year.9 While still higher than pre-pandemic levels, the stabilization of used vehicle prices suggests a more favorable market for consumers as supply levels normalize.
Salvage Summary
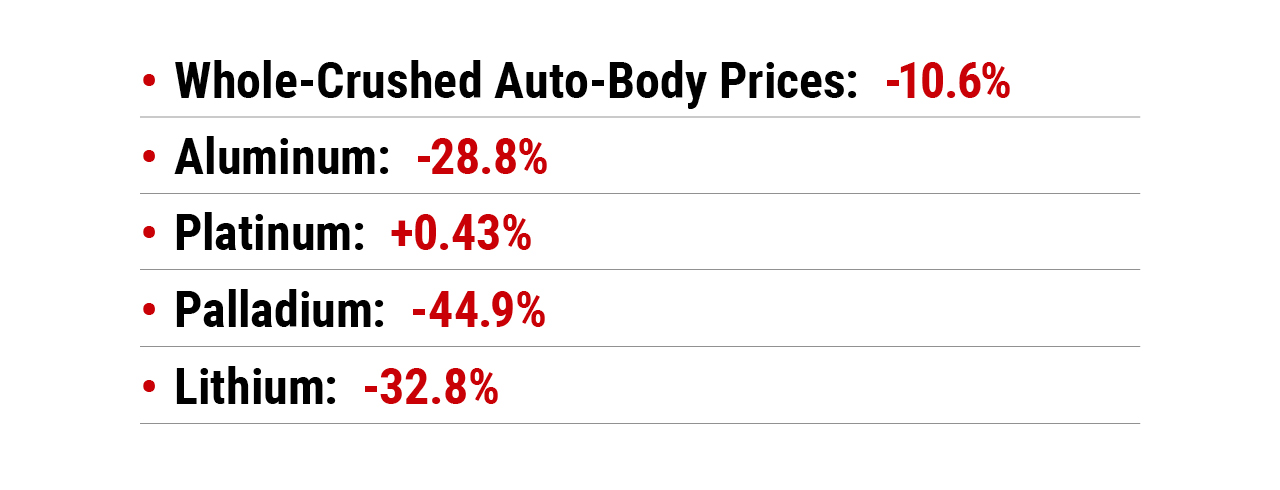
Despite a troubled start to 2023, whole crushed auto-body prices stabilized throughout the year. As the shock to metals manufacturing and supply induced by the war in Ukraine subsided and production ramped back up, steel scrap prices decreased 18.2% from the 2022 yearly average.10 Even amid high volatility in the scrap metal industry and metal markets overall, crushed car prices remained at or above $220, though it was forced to a year-over-year reduction in average crushed car price at -10.6%.11 The aluminum market experienced a price regression of 28.8% following overestimated and greatly minimized demand from China’s real estate sector.12 Platinum’s price grew by 0.43% compared to 2022, an increase encouraged by energy giant Eskom’s restrictions on major metal manufacturers that curtailed energy use and, effectively, supply.13 Palladium took the greatest price hit with a 44.9% year-over-year slump.14 This came as automakers sought more inexpensive sources in response to the metal’s inflation. This reduction was compounded by developing interest and investment into EVs, particularly those that do not require palladium. After such high demand for a metal key in the production of EVs and the hiking of its price, lithium tanked with a bubble burst in 2023, falling to a year-over-year decrease of 32.8%.15

2023: U.S. ECONOMIC READJUSTMENT
Real GDP in the United States continues to normalize despite residual effects from the COVID-19 pandemic. Compared to a 2.1% increase in 2022, last year closed with a 2.5% increase in real GDP.16 These increases in real GDP were fueled by boosts in consumer spending, fixed investment, state and local government spending, exports, and federal government spending. Consumer spending in 2023 enjoyed an increase in durable goods, motor vehicles, and parts - a welcome change following decreases the previous year. From a quarterly perspective, GDP was steady at 2.5% for Q1 and Q2, but rose to 4.9% in Q3 before falling back to 3.3% to end the year.17 The deceleration in Q4 can be attributed to decreases in several spending areas, but specifically investment and federal government spending.18 Overall, the U.S. economy continued to exhibit resiliency in 2023.

LONG-AWAITED INFLATION DECREASE IN 2023
With record-breaking inflation and CPI numbers in 2021, the United States hoped for a substantial decrease in the CPI in 2023 – and that is exactly what occurred. After a year-over-year increase of 6.5% in 2022, prices only grew by 3.4% in 2023, marking a substantial decline from the 40-year high of 9.1% in 2021.20 Consumer goods had an expected general increase of 2.7%, while health services decreased -0.5%.21 The motor vehicle market navigated some interesting changes as well, including a sizeable increase in motor vehicle insurance of 20.6% and a decrease in motor vehicle parts by 0.8%.22 After the 2021-22 surge in used cars, the 2023 market shifted toward new vehicles again, which should continue to stabilize the market. In addition, there was a decrease in CPI of energy by 4.6%, with a notable 6.4% decline in gasoline year-over-year.23 With energy prices dominating headlines through 2022, these decreases are fairly significant, and gas prices may reach pre-pandemic levels in the near future.

THE LABOR MARKET REMAINS RESILIENT
Similar to 2022, the unemployment rate remained resilient in the United States. What once sat at an astounding 14.7% at the peak of the pandemic now sat at 3.7% in December 2023.24 Unemployment ended at 3.5% in December of 2022, with a -0.5% change year-over-year. In addition, the participation rate was last reported at 62.5%, a slight increase from 62.3% a year prior.25 However, the number of senior workers continues to decrease, with the working population of 65+ at 19.0%.26 Finally, several notable industries enjoyed substantial employment increases, including healthcare and government jobs.27

WAGE GROWTH PEAKS
In December 2023, according to the Federal Reserve Bank of Atlanta’s Wage Growth Tracker, there was a 5.2% increase in wage growth over the course of the year, compared to 6.1% in 2022.28 Notably, while job switchers were still experiencing larger wage gains (+6.1%) relative to job stayers (+5.1%), this gap is continuing to converge as the labor market tightens following the “Great Resignation”.29 As job openings continue to soften, so too does labor demand, which is contributing to slightly slowed wage increases.30 Analysts such as Nick Bunker from Indeed suggest wages will continue to cool into 2024, citing reduced labor demand, as well as the reduced supply of workers due to diminishing job departures across the market - all of which will lead to smaller wage increases.31

THE RISE OF THE DOLLAR IN 2023
After a significant 10.7% increase in the index of the U.S. dollar from 2021-2022, 2023’s year-over-year increase fell to 0.1%.32 While the increase may be small, the U.S. dollar continues to exhibit strength compared to foreign currencies, along with our purchasing power. Similar to last year, rising interest rates played a key role in maintaining this strength, as U.S. investment opportunities appear more attractive in the higher rate environment.33 As the Federal Reserve continues to hold rates at current levels, experts expect the strength of the U.S. dollar to hold.34
CONTINUED RISING PRICES AT THE PUMP
After incredibly high average prices for gas and diesel in 2022, things began to settle in 2023. Compared to $4.06 and $4.99 for gas and diesel, respectively, in 2022, last year’s averages were $3.39 and $3.68.35 While the 2022 spike was caused by increased crude oil prices, those began trending downward in 2023 after additional refinery capacity came online.36 The U.S. Energy Information Administration anticipates this new refinery capacity will continue to ease oil market pressures moving into 2024.37

NEW VEHICLE PRICES ON THE DECLINE WITH INVENTORY SURPLUS
At the end of 2023, the supply of new vehicles was around 50% higher than 2022 at 2.66 million vehicles. This spike in inventory increased demand with a 12.5% year-over-year increase in average new vehicle sales.38 A contributing factor was the resolution of many supply chain shortages. The semiconductor microchip shortage created a massive challenge in new vehicle production from 2020 through 2022, but automakers have adapted while the shortage has reasonably subsided.39 According to Cox Automotive, the average listing price for a new vehicle reached a two-year high in December 2023 with an average of $48,805 - up 1.9% from the prior year.40 However, the increase in listing price was offset by various incentives that pushed the transactions price down 2.4% for the year.41

USED VEHICLE PRICES STILL RECOVERING FROM HISTORIC SPIKES
While used vehicle prices are still elevated relative to historical standards, they continued to trend downward in 2023, according to the Manheim Used Vehicle Value index, declining 7.1% in terms of wholesale prices.42 Cox Automotive reported that the average listing price on used vehicles was $26,091 to end 2023, which represents a 3.9% decrease year-over-year.43 While this is good news, it is still significantly higher than pre-pandemic prices, which were under $20,000. The used car market in 2023 was more consumer friendly than years prior with vehicle supply reaching 2020 levels, and prices are expected to continue stabilizing.44

HIGH DEMAND FOR AUTOMOTIVE SCRAP, THROUGH PRICES REMAIN STEADY
For a third consecutive year, the average whole crushed auto-body price remained above $200. However, this comes after a year-over-year reduction of 10.6%, falling to $214/ton.45 This accompanied the plummeting demand of stainless and alloy steel scrap entering Q1, which resulted from record-high prices and a shift in demand towards mined sources for both copper and steel. After the war in Ukraine led to a marked strain on the steel supply chain and a meteoric rise in production costs for stainless and alloy steel scrap in February 2022, lead times have begun returning to normal, while product prices settled in Q3 and Q4.46 This allowed for ramped-up production and supply of these scraps, and thus a downward push on pricing with a year-over-year decrease of 18.2%.47
It was anticipated that there would be a dramatic influx in demand for copper from China and its real estate sector at the beginning of the year due to the country’s rising GDP.48 This failed to come to fruition, however, as its manufacturing sector could not accommodate the growth.49 This issue was compounded as ramped-up protests by miners in Peru, the second-largest producer of copper, culminated in a 25% crash in the export of the metal to open up Q1.50 After reaching a yearly high of US$9,406.01 at the end of January, copper was pushed downwards by the lack of demand in China only to climb again at the end of Q2 with a recession in the USD.51 On the back of further volatility in the dollar, prices peaked at the end of July, falling late in Q3 during September as production resumed near-normal activity when the Peruvian government committed to settling with protestors.52 In Q4, prices began to rise once again as LME inventory and Chinese stockpiles reached lows. Prices continued to climb until the end of the quarter with further supply strain brought on by geopolitical events in Panama, resulting in protests and the temporary closure of one of First Quantum Minerals’ mines.53
While steel prices entered 2023 at a low point, some leading steelmakers hiked prices in anticipation of a spike in demand.54 Following a surge, hot rolled coil (HRC) steel began to decline as mill lead times grew.55 Steel prices dropped significantly late in Q3 and into Q4 after the major United Auto Workers (UAW) strike in which around 48,000 workers walked out and halted production at approximately 50 plants.56 To close out Q4, prices rose once again as the gap between future and spot prices continued to develop and steelmakers once again hiked prices.57 Due to this volatility in copper and steel prices, whole crushed auto-body prices experienced a reduction.

ALUMINUM, PLATINUM, AND PALLADIUM
At the start of 2023, the price of aluminum gradually began to fall, reaching its plateau and maintaining this price at the top of Q3 going into the end of Q4, culminating in a year-over-year reduction of 28.8%.58 This followed a faltering demand from a lagging Chinese real estate sector, regressed U.S. demand, and an unmatched post-pandemic surge in supply.59 Platinum maintained relative stability as the average yearly price rose a mere 0.43%, largely due to a bump incurred early in Q2.60 This bump may be attributed to the decreased production imposed by Eskom and their load-curtailment requests in which high-energy users were asked to mitigate consumption, which limited furnace and smelter operations.61 This restriction curbed supply and contributed to said price hike, which peaked at a yearly high of $1,070.05/troy oz.62 Palladium prices trended in directions similar to platinum. It too entered the year at a decline, but unlike platinum, palladium declined by a dramatic 44.9% year over year.63 Lingering effects of the war in Ukraine and the expectation for a surplus of cheaper palladium options played a hand in this downward pressure.64 Additionally, shifting to EVs that do not require palladium facilitated this rapid descent.65


EV MARKET CONTINUES TO FLOURISH
In 2023, the EV market was approximately 13.6 million, a 31.7% yearly increase.66 Of this complete plug-in vehicle category, 9.5 million were BEVs - an increase of 21.8% compared to the previous year.67 While this was not as extreme as the 55% growth experienced by fully electric vehicles between 2021 and 2022, shifts in global market share are more impressive.68 Despite a slightly more sluggish year, EVs finished 2023 with a 16% share of the global auto market. This was up from 14% in 2022, a more substantial upward shift than 2021 and 2022 (+4.5% and +5.3%, respectively).69 With the continued advancement and commercial viability of EV technology, companies are committing to electric production plans. Some of these shifts are underway with manufacturing giants such as General Motors, Ford, and Volkswagen aiming to be fully electric in the coming decade(s).70 Despite dominating the EV space in the U.S. in 2022 with a steady 65% share of the market, Tesla finished off 2023 with 56.5% - an 8.5% slip with a share as low as 50% in Q3.71 This aforementioned influx in competition has pressured Tesla as larger manufacturers offer competitive prices with decreased production costs.72 Similar to this trend in more affordable EVs, Chinese auto manufacturer BYD has experienced explosive success with the introduction of their budget EV options, narrowly edging out Tesla in the final quarter of 2023.73 It is clear that EV competition is only going to continue growing in the coming years.


THE ELECTRIFICATION OF LCV FLEETS AND THE PUSH TO DECARBONIZE
Electric light commercial vehicles (LCVs) have begun to dominate the delivery space. Whether it be package or food delivery, companies are moving toward decarbonization of their fleets. As of October 2023, Amazon had approximately 40,000 vans in its U.S. delivery fleet.74 Of this total, 10,000 were all-new electric vans made in partnership with Rivian.75 This is only the beginning as Amazon plans to completely retire its global fleet of over 100,000 gas-powered vehicles, with the end goal of putting 100,000 Amazon-branded Rivian vans on U.S. streets by 2030.76 As it moves toward electric means of shipment, Amazon has begun to install charging stations, reaching an EV charging network of over 12,000 in the U.S. alone.77 These trends have industry-wide reaches as leading package shipment competitors (by package volume) USPS and UPS have their own decarbonization objectives with similar timelines.78 In the case of USPS, the agency will be purchasing 106,000 delivery vans by 2028 to replace their existing fleet - 66,000 of which will be EVs.79 An influx of discontinued NGVs can be expected in the coming years, particularly in densely populated areas as Amazon targets and prioritizes larger cities for its decarbonization plans.

EV METALS
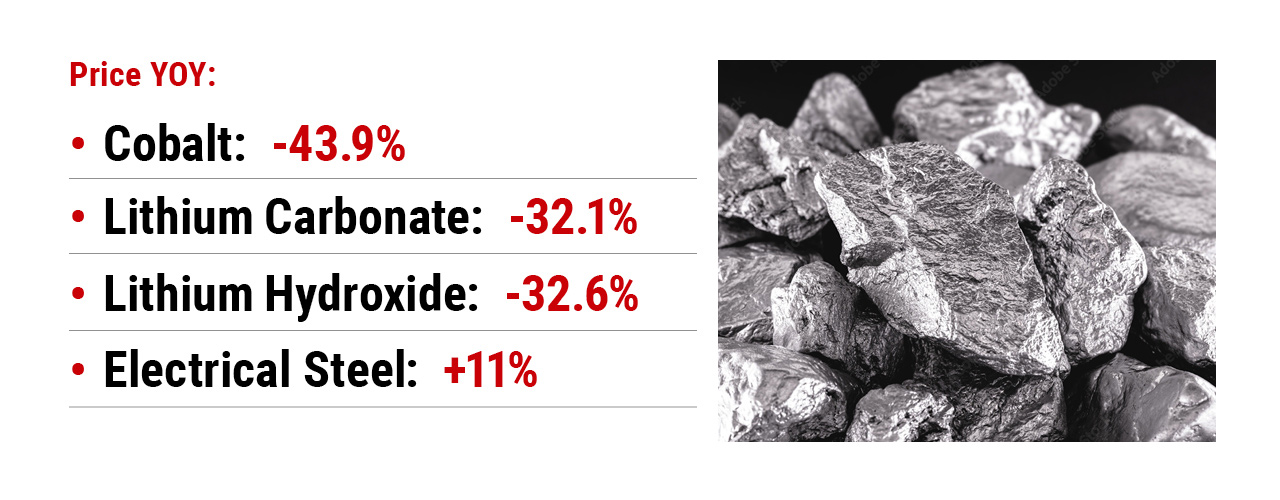
In 2023, there was a -43.9% change in cobalt prices.80 This significant downward pressure came as supply rose in Q1 and Q2, yet the expected demand coming from the EV market was not matched.81 Major automakers have begun or plan to move away from cobalt batteries, opting for cheaper, more efficient alternatives such as lithium-iron-phosphate batteries.82
Lithium prices continued to plummet in 2023 at a year-over-year regression of 32.8%, only rising once in June.83 Lithium carbonate and lithium hydroxide fell at similar rates, finishing 2023 with YOYs of -32.1% and -32.6%, respectively.84 Major lithium sellers continued to raise prices, causing this inevitable bubble burst.85 Electrical steel prices rose 11% over the course of 2023, signifying increased demand.86 EVs rely on electrical steel for their electric motors, and as of December 2023, this specialized metal only makes up 1% of all steel produced.87 Not only does it hold indispensable value for EV production but, in the short-term (2020-2025), electrical steel was labeled a near-critical resource by the Department of Energy as it is crucial in ongoing development in energy and is susceptible to supply disruptions.88
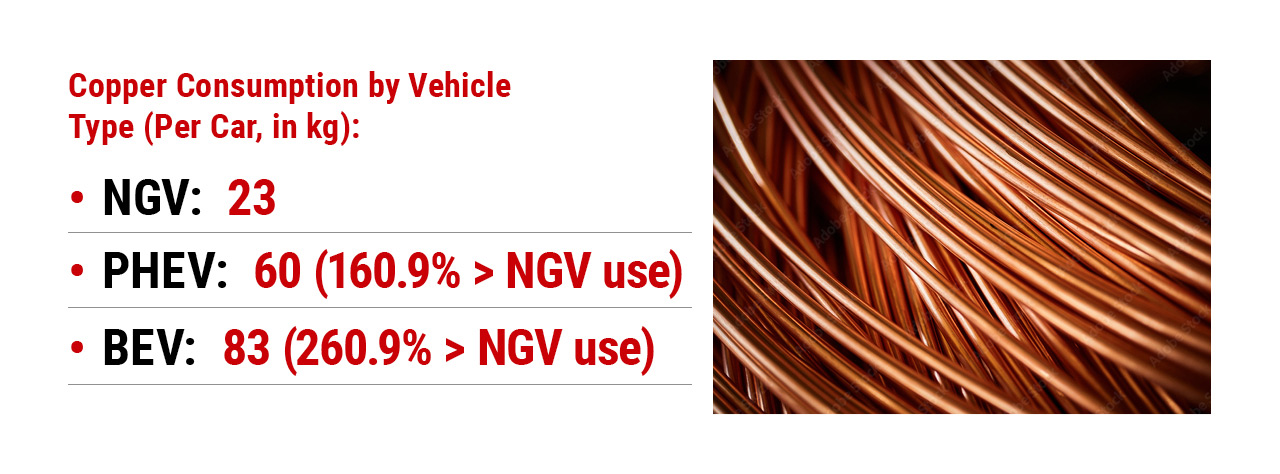
Another near-critical material, copper demand is projected to increase with growing EV production and the development of wind power.89 EV market growth continues to drive copper demand. More specifically, PHEVs require 100% more copper than NGVs, and BEVs rely on 260.9% more copper than their internal combustion counterparts.90 The EV market is already responsible for 55% of copper demand, a proportion that is only projected to rise in the coming years.91

ECONOMY
Having avoided a recession in 2023, real GDP growth is still expected to slow in 2024 and in future years as the U.S. economy settles into pre-pandemic behavior.92 The unemployment rate is expected to rise slightly alongside softening labor demand, placing early expectations for unemployment in the low 4% range through 2024, according to Congressional Budget Office (CBO) estimates.93 As part of the longer term targeting by the Federal Reserve, analysts at the CBO expect inflation to continue to slow towards the 2% target, while interest rates are expected to decline as well.94
GEOPOLITICAL UNCERTAINTY
The Israel–Palestine conflict may have compounded issues already made visible by the Russo-Ukraine war, although Treasury Secretary Janet Yellen has claimed the U.S. economy is unlikely to be significantly impacted by events in Gaza.95 However, geopolitical uncertainty has been shown to negatively impact and reduce behaviors related to cross-border investment.96 Some of the major supply chain disruptions attributed to the issues of 2022 have been resolved or are well on their way to resolution.97 The Federal Reserve Bank of New York’s Global Supply Chain Pressure Index achieved its all-time low in 2023, which has likely contributed to some of the easing price pressure in the economy.98
AUTOMOTIVE INDUSTRY
While new car listing prices slightly increased (without taking incentives into account), used car prices declined dramatically over 2023.99 Cox Automotive expects these current prices to remain stable in 2024 as the market continues to normalize.100 High interest rates on auto loans are expected to be a challenge going forward for buyers. Auto Loan Delinquencies are already at 13-year highs, and the consumer sector is feeling some credit stress after years of inflationary pressure, which could play a role in market demand.101
METALS
The prices for cobalt and lithium, two key materials in battery production, have rapidly declined over the course of 2023, undoing much of the 2022 increases. Cobalt dropped from a high of over $81,000 per metric ton in March 2022 to just over $33,000 per metric ton in August 2023.102 Lithium declined even faster, and prices today are less than a quarter of what they were at the beginning of 2023.103 This particular decline may be attributed to the end of the “green” bubble, meaning lower demand for electric vehicles in 2023 amid higher interest rates and excess supply in Asia. The lithium market is not expected to recover until 2028.104 In fact, many base metals across the board are expected to remain at low prices over the course of 2024 due to similar low demand and oversupply related factors. Aluminum also saw a price decrease over the same period, but prices are expected to rise again along with copper.105

HIGH INFLATION AND INTEREST RATES TROUBLE CANADIAN ECONOMY
The Canadian economy was stable in 2023, remaining relatively flat rather than steadily growing. In fact, Real GDP grew by an estimated 1.1% for the year.106 In 2023, the unemployment rate was also relatively stable, moving from 5.4% to 5.5% over the course of the year. 107 High interest rates have been heavily impacting the lives of many Canadians, ending the year at 5%. The Bank of Canada introduced this rate in an effort to curb inflation.108 This strategy was generally successful considering the inflation rate ended the year at 3.4%, a significant decrease from the January measure of 5.9%.109 Change may not be readily forthcoming despite constant discussion about the balance between the inflation rate and interest rates. Tiff Macklem, Governor of the Bank of Canada, has said “inflation is still too high” and there will be “future discussion about how long we maintain the policy rate at 5%.”110 Certain economists believe that when interest rates are eventually lowered, they could be around the 3% level. Looking forward into 2024, there is hope for more predictable interest rates.111 The current 5% rate is a 40-year peak that can be expected to fall when inflation rates settle down.112 Finding the balance point between these two rates will be key to keeping the Canadian economy on track.

UNITED KINGDOM'S ECONOMY SLOWS BUT STABILIZES
The UK economy has shown signs of slowing and is forecasted to achieve only 1.6% growth despite 7.6% in 2021 and 4% in 2022.113 However, this growth outperforms forecasts from 2022, which anticipated a 0.4% reduction.114 Meanwhile, unemployment has remained below 4% throughout 2023, though it may have risen back to 4% depending on estimates from recent months.115 This comes at the same time inflation measured by CPI dropped from 10.5% in December 2022 to 4% in December 2023, signaling that the cost of living is still rising, albeit at a significantly slower rate than the previous year.116 Such a reduction in the inflation rate came at the cost of some of the highest interest rates ever recorded, which might be relaxed somewhat over the course of 2024.117 However, this inflation rate remains above the Bank of England’s usual 2% target.There is some hope that the economy will rebound in 2024, though the government Office for Budget Responsibility forecasts only a 0.7% GDP growth rate, barely higher than the equivalent figure for 2023 of 0.6%.118
DISCLAIMER
The statements made in this 2023 RB Global Industry Report (the “Report”) are based on the data obtained by IAA from the sources cited throughout this Report. These statements are not necessarily those of the RB Global, Inc. or its management. The facts and data provided in this Report should not be relied upon and are not intended to be predictions or expectations of future performance. The Report is provided for informational purposes only and shall not be considered a warranty or guarantee of any kind. You agree you are not relying on any information contained herein as advice whether or not to enter into a particular transaction or take any particular action. You should only make such decisions after your own diligence and upon your own judgment and advice from such advisers as you have deemed necessary.
FORWARD LOOKING STATEMENTS:
RB Global, Inc. (NYSE: RBA) (TSX: RBA) is a leading omnichannel marketplace that provides value-added insights, services, and transaction solutions for buyers and sellers of commercial assets and vehicles worldwide. This 2023 RB Global Industry Report (the “Report”) includes forward-looking information within the meaning of Canadian securities legislation and forward-looking statements within the meaning of Section 27A of the Securities Act of 1933 (the “Securities Act”) and Section 21E of the Securities Exchange Act of 1934 (the “Exchange Act”) and Canadian securities laws. Forward-looking statements are typically identified by such words as “aim”, “anticipate”, “believe”, “could”, “continue”, “estimate”, “expect”, “intend”, “may”, “ongoing”, “plan”, “potential”, “predict”, “will”, “anticipates”, “should”, “would”, “could”, “likely”, “generally”, “future”, “long-term”, “foresees”, “estimates”, “opportunity” or the negative of these terms, and similar expressions intended to identify forward-looking statements. Forward-looking statements are based on current expectations and assumptions that are subject to risks and uncertainties that may cause actual results to differ materially. These statements are based on our current expectations and estimates about our business and markets, and may include, among others, statements relating to the U.S. and global market, industry information and trends, our future strategy, objectives, targets, projections and performance and other statements that are not historical facts. It is uncertain whether any of the events anticipated by the forward-looking statements will transpire or occur, or if any of them do, what impact they will have on the results of operations and financial condition of the combined companies or the price of RB Global’s common shares. Therefore, you should not place undue reliance on any such statements, and caution must be exercised in relying on forward-looking statements. While RB Global’s management believes the assumptions underlying these forward-looking statements are reasonable, these forward-looking statements involve certain risks and uncertainties, many of which are beyond RB Global’s control, that could cause actual results to differ materially from those indicated in such forward-looking statements, including but not limited to: our results of operations, strategy and plans; potential adverse reactions or changes to our business or employee relationships; our ability to integrate acquisitions (including IAA, Inc. ), the diversion of management time on transaction-related issues; the ability of RB Global to retain and hire key personnel and employees; the significant costs associated with the merger; the outcome of any legal proceedings that could be instituted against RB Global; changes in capital markets and the ability of the company to generate cash flow and/or finance operations in the manner expected or to de-lever in the timeframe expected; the failure of RB Global to meet financial forecasts and/or KPI targets; legislative, regulatory and economic developments affecting the business of RB Global; general economic and market developments and conditions; the evolving legal, regulatory and tax regimes under which RB Global operates; unpredictability and severity of catastrophic events, including, but not limited to, pandemics, acts of terrorism or outbreak of war or hostilities, as well as RB Global’s response to any of the aforementioned factors. Other risks that could cause actual results to differ materially from those described in the forward-looking statements are included in RB Global’s periodic reports and other filings with the Securities and Exchange Commission (“SEC”) and/or applicable Canadian securities regulatory authorities, including the risk factors identified under Part I, Item 1A “Risk Factors” in RB Global’s most recent Annual Report on Form 10-K for the year ended December 31, 2023, as such risk factors may be amended, supplemented or superseded from time to time by other reports we file with the SEC and/or applicable Canadian securities regulatory authorities, including subsequent Quarterly Reports on Form 10-Q and Annual Reports on Form 10-K. The forward-looking statements included in this Report are made only as of the date hereof. While the list of factors presented here is considered representative, no such list should be considered to be a complete statement of all potential risks and uncertainties. Many of these risk factors are outside of our control, and as such, they involve risks which are not currently known that could cause actual results to differ materially from those discussed or implied herein. RB Global does not undertake any obligation to update any forward-looking statements to reflect actual results, new information, future events, changes in its expectations or other circumstances that exist after the date as of which the forward-looking statements were made, except as required by law.
REFERENCES
https://matthey.com/products-and-markets/pgms-and-circularity/
https://matthey.com/products-and-markets/pgms-and-circularity/
https://www.benchmarkminerals.com/price-assessments/lithium/
https://www.metallic.com/news-item/market-update-2/ ; https://fred.stlouisfed.org/series/
https://investingnews.com/daily/resource-investing/base-metals-investing/ ; https://www.reuters.com/markets/commodities/
https://www.reuters.com/markets/commodities/ ; https://www.aluminum.org/news/
https://matthey.com/products-and-markets/pgms-and-circularity/
https://matthey.com/products-and-markets/pgms-and-circularity/
https://matthey.com/products-and-markets/pgms-and-circularity/
https://www.visualcapitalist.com/electric-vehicle-sales-by-model-2023
https://www.investopedia.com/teslas-share-of-us-electric-vehicle
https://www.investopedia.com/teslas-share-of-us-electric-vehicle ; https://explodingtopics.com/blog/
https://capitaloneshopping.com/research/amazon-logistics-statistics/
https://www.eenews.net/articles/inside-amazons-ev-charging-challenge/
https://capitaloneshopping.com/research/amazon-logistics-statistics/
https://www.cnet.com/news/usps-to-buy-66000-electric-delivery-vehicles
https://www.spglobal.com/commodityinsights/en/market-insights/latest-news/metals/
https://www.spglobal.com/commodityinsights/en/market-insights/latest-news/metals/
https://www.spglobal.com/commodityinsights/en/market-insights/latest-news/metals/
https://www.benchmarkminerals.com/price-assessments/lithium/
https://www.benchmarkminerals.com/price-assessments/lithium/
https://www.chemanalyst.com/Pricing-data/electrical-steel-1357
https://eepower.com/news/securing-the-supply-of-electrical-steel
https://www.energy.gov/cmm/what-are-critical-materials-and-critical-minerals
https://www.copper.org/environment/sustainable-energy/renewables/
https://www.automotiveworld.com/articles/copper-crunch-hits-hard-in-ev-push/
https://www.cnn.com/2023/10/11/economy/janet-yellen-israel-hamas-economy/
https://www.investopedia.com/supply-chains-have-healed-from-pandemic-disruptions
https://www.investopedia.com/supply-chains-have-healed-from-pandemic-disruptions
https://www.benchmarkminerals.com/price-assessments/lithium/
https://finance.yahoo.com/news/caused-dramatic-drop-lithium-prices
https://www.statista.com/statistics/578362/unemployment-rate-canada/
https://www.cbc.ca/news/business/bank-of-canada-interest-rate
https://www.cbc.ca/news/business/bank-of-canada-interest-rate
https://www.cbc.ca/news/business/bank-of-canada-interest-rate


